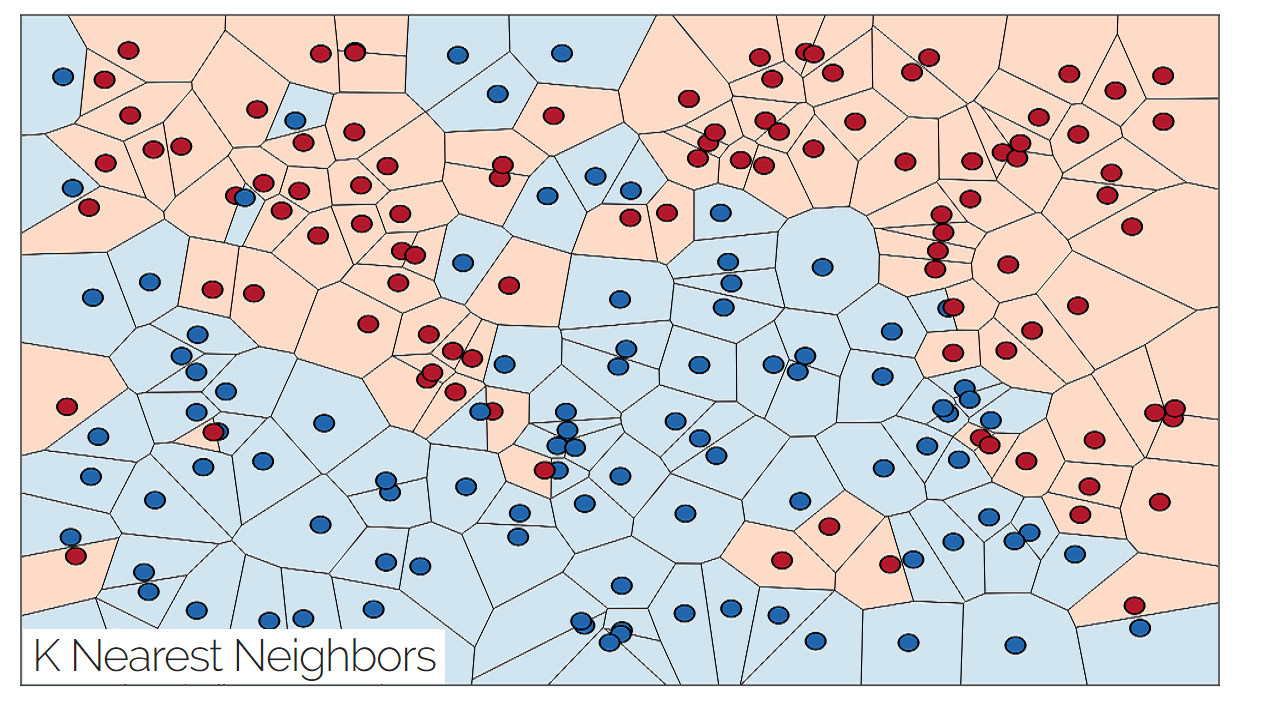
K nearest neighbros is a simple supervised learning algorithm that consists of computing the k closest training examples in the feature space.
I'm going to use basketball statistics for this example since I have them on hand, but it is a bad dataset for this algorithm.
| Name | Average Points | Variance Points | Opponent Average Points | Points |
|---|---|---|---|---|
| Anthony Davis | 55.1316 | 321.98 | 203.155 | 67 |
| DeMarcus Cousins | 48.1 | 139.74 | 202.22 | 62.4 |
| Russell Westbrook | 58.4 | 133.23 | 209.55 | 58.4 |
| Blake Griffin | 40.095 | 55.81 | 209.71 | 53.7 |
| Serge Ibaka | 26.555 | 84.34 | 191.70 | 48.4 |
| Rudy Gay | 33.1278 | 97.208 | 202.22 | 41.8 |
| Kristaps Porzingis | 34.5947 | 61.93 | 204.37 | 39.8 |
| Paul George | 36.05 | 52.6875 | 185.019 | //predict this |
Say you want to predict how much Paul George is going to score on a given night, and you have all previous games statistical data. In the dataset above, Paul George's points will be the unknown. The nearest neighbors algorithm finds the distance between all the different input variables from each other. The input variables in this case will be average points, variance points, and opponents average points. The output is the actual number of points each player scored on a given night. We want to find the K closest distances to Paul George's statistics.
Distance
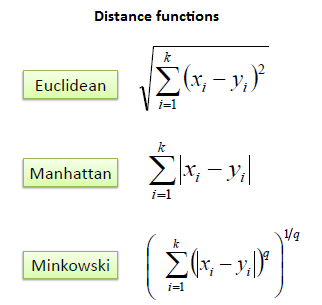
For this example I'm going to use Euclidean distance. To compute the distance between Paul George and Kristaps Porzingis we would do: square_root((36.05-34.5947)^2 + (52.6875-61.93)^2+(185.019-204.37)^2) You would repeat this computation for all rows of data (i.e. Paul George distance to Anthony Davis, Paul George distance to DeMarcus Cousins, etc.) , and the nearest K neighbors would be the K players with the smallest Euclidean distance to Paul George. This equates to the players most statistically similar to Paul George
Standardize data
The biggest issue with the computation above is the data isn't standardized. For example the distance between point variance and point average is likely going to be a lot higher, causing variance to have a lot higher weight in the distance computation. Looking at the Kristaps Porzingis vs Paul George example, the difference between average points (36.05-34.5947)=1.4553 and variance points (52.6875-61.93)=-9.2425 is a lot further off, especially after you square each number in the Euclidean formula. This will lead to variance having a lot higher influence in the overall formula. To counter this, we can standardize the variables between 0 and 1:
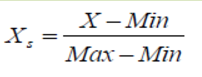 Where X is a given variable for a player, and Min and Max are the minimum and maximum amounts of that particular variable within the dataset. Example:
Average points max=58.4 (Russell Westbrook)
Average points min=26.555 (Serge Ibaka) Paul George's average points in this standardization computation would be
(36.05-26.555)/(58.4-26.555)=0.298
This is a very basic standardization technique, but it will work for this example. Extreme outliers can greatly skew this computation so it is not ideal a lot of the time.
Where X is a given variable for a player, and Min and Max are the minimum and maximum amounts of that particular variable within the dataset. Example:
Average points max=58.4 (Russell Westbrook)
Average points min=26.555 (Serge Ibaka) Paul George's average points in this standardization computation would be
(36.05-26.555)/(58.4-26.555)=0.298
This is a very basic standardization technique, but it will work for this example. Extreme outliers can greatly skew this computation so it is not ideal a lot of the time.
C# Example
Say we have a list named "tonight" of players playing tonight. We do not know how many points they will score. We can compute another list titled "previous" of players who played on a previous night. We know how many points players on previous nights scored. We also have average, variance, and opponent average for each player in both lists. To compute a list of distances we can do the following:
Dictionary<string,List<double>  player_Alldistances = new Dictionary<string,List<double>>();
foreach(player p in tonight){
    List<double> distances = new List<double>();
    foreach(player p2 in previous){
           distances.Add(calculateDistance(p, p2));
    }
    player_Alldistances.Add(p.Name, distances);
}
public static double calculateDistance(player p, player p2)
{
    double mean = Math.Pow((p.meanPoints - meanMin) / (meanMax - meanMin) -
        (p2.meanPoints - meanMin) / (meanMax - meanMin), 2);

    double variationPoints = Math.Pow((p.variancePoints - variancePointsMin) / (variancePointsMax - variancePointsMin) -
        (p2.deviationPoints - variancePointsMin) / (variancePointsMax - variancePointsMin), 2);

    double opptTotalPointsAverage = Math.Pow((p.OpptTotalPointsAverage - OpptTotalPointsAverageMin) / (OpptTotalPointsAverageMax - OpptTotalPointsAverageMin) -
        (p2.OpptTotalPointsAverage - OpptTotalPointsAverageMin) / (OpptTotalPointsAverageMax - OpptTotalPointsAverageMin), 2);

    double distsum = mean + variationPoints + opptTotalPointsAverage;
    double distance= System.Math.Sqrt(Math.Abs(distance));

    return distance;
}
foreach(KeyValuePair<string, List<double>> entry in player_Alldistances)
{
    //get index of top 2%
    int twoPercent = entry.Value.Count * .02;
    entry.Value=entry.Value.OrderByAscending(x => x).ToList();
    double total = 0;
    for(int i = 0;i(less than)twoPercent;i++){
        total+=entry.Value.ElementAt(i);
    }
    double average = total / twoPercent;
    Console.Write(entry.Key+" guessed value="+average);
}
Doing this manually, say we set K=2.Here are the raw computations. Not making pretty because lazy.
PG-The Unibrow: sqrt((((36.05-26.555)/(58.4-26.55))-((55.1-26.55)/(58.4-26.55)))^2+(((52.68-52.68)/(321.98-52.68))-((321.98-52.6875)/(321.98-52.6875)))^2+(((185.019-185.019)/(209.71-185.019))-((203.155-185.019)/(209.71-185.019)))^2)=1.37 PG-Boogie: sqrt((((36.05-26.555)/(58.4-26.55))-((48.1-26.55)/(58.4-26.55)))^2+(((52.68-52.68)/(321.98-52.68))-((139.74-52.6875)/(321.98-52.6875)))^2+(((185.019-185.019)/(209.71-185.019))-((202.22-185.019)/(209.71-185.019)))^2)=0.856 PG-RW: sqrt((((36.05-26.555)/(58.4-26.555))-((58.4-26.555)/(58.4-26.555)))^2+(((52.6875-52.6875)/(321.98-52.6875))-((133.23-52.6875)/(321.98-52.6875)))^2+(((185.019-185.019)/(209.71-185.019))-((209.55-185.019)/(209.71-185.019)))^2)=1.25 PG-BG: sqrt((((36.05-26.555)/(58.4-26.555))-((40.095-26.555)/(58.4-26.555)))^2+(((52.6875-52.6875)/(321.98-52.6875))-((55.81-52.6875)/(321.98-52.6875)))^2+(((185.019-185.019)/(209.71-185.019))-((209.71-185.019)/(209.71-185.019)))^2)=1.008 PG-SI: sqrt((((36.05-26.555)/(58.4-26.555))-((26.555-26.555)/(58.4-26.555)))^2+(((52.6875-52.6875)/(321.98-52.6875))-((84.34-52.6875)/(321.98-52.6875)))^2+(((185.019-185.019)/(209.71-185.019))-((191.70-185.019)/(209.71-185.019)))^2)=0.4194 PG-RG: sqrt((((36.05-26.555)/(58.4-26.555))-((33.1278-26.555)/(58.4-26.555)))^2+(((185.019-52.6875)/(321.98-52.6875))-((97.208-52.6875)/(321.98-52.6875)))^2+(((185.019-185.019)/(209.71-185.019))-((202.22-185.019)/(209.71-185.019)))^2)=0.7746 PG-KPizzle: sqrt((((36.05-26.555)/(58.4-26.555))-((34.5947-26.555)/(58.4-26.555)))^2+(((52.6875-52.6875)/(321.98-52.6875))-((61.93-52.6875)/(321.98-52.6875)))^2+(((185.019-185.019)/(209.71-185.019))-((204.37-185.019)/(209.71-185.019)))^2)=0.7858
The two closest neighbors, Serge Ibaka and Rudy Gay scored 48.4 and 41.8 points, for an average of 45.1 points.
Weighting
It's useful to assign weights to each neighbor depending on how close they are. A common method is to use 1/d, where d is the distance. For the example above, Serge Ibaka is the closest neighbor, with d=1. Rudy Gay is second with d=2. The math to compute the output would be (48.4(1/1)+41.8(1/2))/2
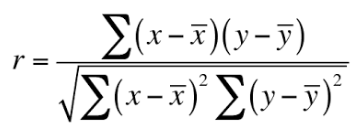
Correlation
PG-The Unibrow: sqrt(.772((((36.05-26.555)/(58.4-26.55))-((55.1-26.55)/(58.4-26.55)))^2+0.356(((52.68-52.68)/(321.98-52.68))-((321.98-52.6875)/(321.98-52.6875)))^2+0.52(((185.019-185.019)/(209.71-185.019))-((203.155-185.019)/(209.71-185.019)))^2)=0.876 PG-Boogie: sqrt(.772((((36.05-26.555)/(58.4-26.55))-((48.1-26.55)/(58.4-26.55)))^2+0.356(((52.68-52.68)/(321.98-52.68))-((139.74-52.6875)/(321.98-52.6875)))^2+0.52(((185.019-185.019)/(209.71-185.019))-((202.22-185.019)/(209.71-185.019)))^2)=0.578 PG-RW: sqrt(.772((((36.05-26.555)/(58.4-26.555))-((58.4-26.555)/(58.4-26.555)))^2+0.356(((52.6875-52.6875)/(321.98-52.6875))-((133.23-52.6875)/(321.98-52.6875)))^2+0.52(((185.019-185.019)/(209.71-185.019))-((209.55-185.019)/(209.71-185.019)))^2)=0.895 PG-BG: sqrt(.772((((36.05-26.555)/(58.4-26.555))-((40.095-26.555)/(58.4-26.555)))^2+0.356(((52.6875-52.6875)/(321.98-52.6875))-((55.81-52.6875)/(321.98-52.6875)))^2+0.52(((185.019-185.019)/(209.71-185.019))-((209.71-185.019)/(209.71-185.019)))^2)=0.6433 PG-SI: sqrt(.772((((36.05-26.555)/(58.4-26.555))-((26.555-26.555)/(58.4-26.555)))^2+0.356(((52.6875-52.6875)/(321.98-52.6875))-((84.34-52.6875)/(321.98-52.6875)))^2+0.52(((185.019-185.019)/(209.71-185.019))-((191.70-185.019)/(209.71-185.019)))^2)=0.3190 PG-RG: sqrt(.772((((36.05-26.555)/(58.4-26.555))-((33.1278-26.555)/(58.4-26.555)))^2+0.356(((185.019-52.6875)/(321.98-52.6875))-((97.208-52.6875)/(321.98-52.6875)))^2+0.52(((185.019-185.019)/(209.71-185.019))-((202.22-185.019)/(209.71-185.019)))^2)=0.48 PG-KPizzle: sqrt(.772((((36.05-26.555)/(58.4-26.555))-((34.5947-26.555)/(58.4-26.555)))^2+0.356(((52.6875-52.6875)/(321.98-52.6875))-((61.93-52.6875)/(321.98-52.6875)))^2+0.52(((185.019-185.019)/(209.71-185.019))-((204.37-185.019)/(209.71-185.019)))^2)=0.4985